The Bitcoin Halving Is 19 Days Away — How Did BTC Perform In Past Cycles?
BTC posted new all-time highs seven months after past halvings.
By: Samuel Haig • Loading...
CeFi
The markets are trending sideways as Bitcoin’s fourth quadrennial halving is now just 19 days away.
The event, which will reduce the rate of new Bitcoin issuance to 3.125 BTC per block from 6.25 BTC, has historically been followed by unprecedented bullish momentum kicking off later in the same year.
But traders appear uncertain as to what the next halving will bring, with BTC gaining just 2.6% over the past 14 days. Still, Bitcoin has retained most of the gains from its meteoric run into all-time highs following the launch of spot ETFs in January, according to CoinGecko.
Bitcoin’s third halving
On Apr. 22, 2020, 19 days before the last Bitcoin halving, BTC was changing hands at $6,842, with the markets trending mid-range after trading between $6,420 and $7,340 throughout the month of April 2020.
Bitcoin went on to rally by 44% in 17 days and tagged a local high of $9,822 on May 9, with opportunistic sellers pushing the price back to $8,752 come the third halving on May 11, 2020. BTC then dipped to $8,600 the following day, and has never traded at a lower level since.
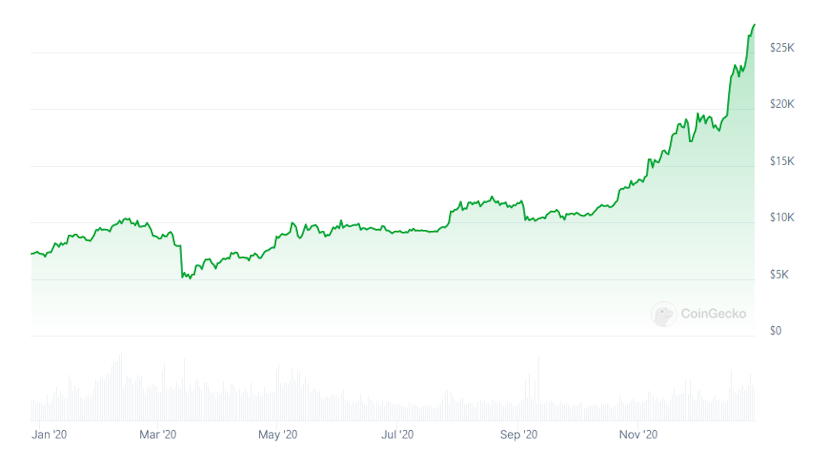
However, the bullish momentum surrounding the third halving occurred under very different macroeconomic circumstances, with cryptocurrencies suffering a violent pullback alongside mainstream markets just one month prior as the United States entered a state of national emergency and instituted travel bans in response to the Covid-19 pandemic in March 2020.
Bitcoin had abruptly crashed to an 11-month low of $5,030 on March 17, 2020, marking a 51% pull-back in less than five weeks. The sharp decline left Bitcoin ripe for a bounce leading up to the previous halving, with BTC then going on to post new all-time highs seven months later — contrasting dramatically from the five months of bullish momentum that produced record highs leading up to Bitcoin’s next halving event.
The second halving
On June 20, 2016, 19 days before the second halving, the markets were starting to retrace from their pre-halving peak. Bitcoin was trading for $734 after dipping 4% in 24 hours, with the previous day’s price action marking a 66% rally in four weeks.
BTC had shed a further 11% as of the second halving on July 9, 2016, before dipping to a low of $517 on August 2 — comprising a 29.5% drop from June 20, 2020, and a 21% retracement since the halving. Bitcoin went on to tag new all-time highs in February 2017, seven months after the second halving.
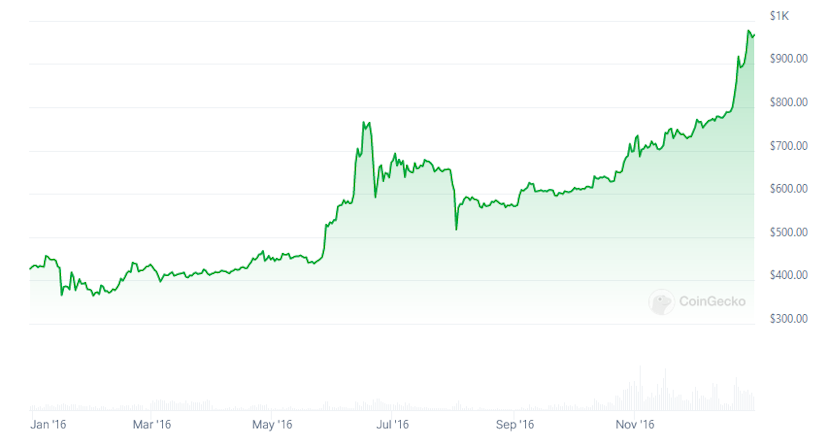
With the combined cryptocurrency capitalization having grown more than 23,300% from around $12 billion on June 20, 2016, today’s digital asset sector is nearly unrecognizable in terms of size and adoption.
Still, the 2016 cycle shows that Bitcoin is not immune from a post-halving pullback following sustained bullish momentum.
Some analysts argue that the recent launch of spot ETFs has disrupted the rhythm of Bitcoin’s mythologized four-year cycle, as evidenced by BTC’s recent all-time highs. However, others suggest that the billions of dollars flowing into spot Bitcoin ETFs serve to intensify the deflationary effect of the halving, and could overshadow it.
Advertisement
Get the best of The Defiant directly in your inbox 💌
Know what matters in Web3 with The Defiant Daily newsletter, every weekday
90k+ investors informed every day. Unsubscribe anytime.